Economic headlines and market fluctuations can make it easy to lose sight of the bigger picture. In this issue of Steady Investor, we examine the trends shaping markets and what they may mean for long-term investors, including:
- What the midterm election results could mean for stocks
- U.S. national debt reaches 100% of GDP
- Why jobs and inflation data may force the Fed’s hand
What the Stunning Results of the Midterm Elections Mean for Stocks – The midterm elections came and went this week, but not without making a huge splash. Democrats flipped at least seven Senate seats and more than two dozen House districts, taking control of both chambers and winning several governorships. Stocks seemed to embrace the results in the first day of trading, but then suffered a wipeout on Thursday that hit Tech stocks the hardest but touched every S&P 500 sector. We would not view the rally or the selloff as a statement on the political setup. Stocks move up or down for many different reasons in the short-term. Looking ahead to the next year, however, there are historical and structural reasons to be optimistic, in our view. Beginning in January, Congress and the White House will be controlled by opposing parties, which makes sweeping new legislation more difficult, reducing the likelihood of major changes in tax and spending policy over the next two years. Historically, legislative gridlock has often been viewed favorably by investors because it can provide businesses with greater policy predictability. The historical results have been clear—from 1928 through 2023, the S&P 500 averaged a 14% price gain in the third year of a presidential term, across administrations of both parties. We see this as a meaningful historical pattern, but for long-term investors, remember it’s still economic growth, corporate earnings, and valuations that will matter more than which party controls Washington.1
What Could Today’s Market Volatility Mean for Your Portfolio?
Could reacting to market swings hurt your portfolio more than the volatility itself? Discover lessons from past downturns and common mistakes to watch for.
Our free guide, Using Market Volatility to Your Advantage², explores how periods of turbulence may create opportunities to strengthen your portfolio. Inside, you’ll learn:
- How market volatility can “shake up” complacent investors
- Potential bargains that may be uncovered through turbulence
- Why volatility may help prevent overheating and market “bubbles”
- What history shows us about opportunities for steady investors in turbulent markets
- Plus, more ways you may be able to benefit from a volatile market
Take a more informed approach to market uncertainty. Download your free copy today!
Download Our Guide, “Using Market Volatility to Your Advantage”2
U.S. National Debt Reaches 100% of GDP – The new Congress may have a laundry list of policy objectives to address, but one of them should arguably be the U.S. national debt, which just reached a significant milestone. At the end of fiscal 2026, federal debt held by the public totaled $32.2 trillion, equivalent to approximately 100% of the country’s annual economic output. The ratio is approaching the historical peak of 106% reached in 1946, following World War II. As recently as 2000, the debt-to-GDP ratio stood at just 33.7%.3
Federal Debt Held by the Public as a Percent of U.S. GDP
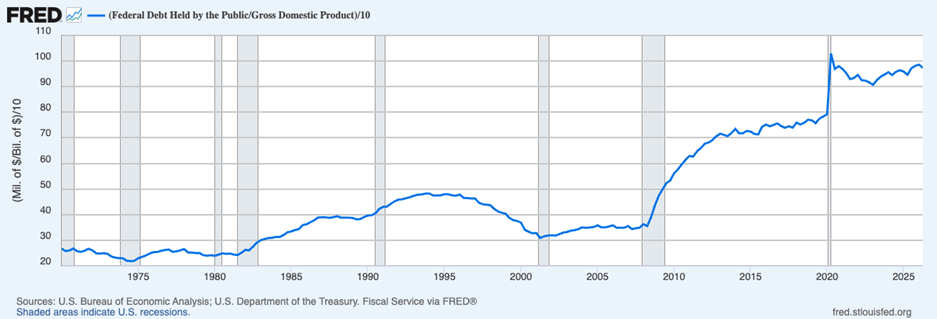
Source: Federal Reserve Bank of St. Louis4
The milestone comes despite continued economic growth. The federal government recorded a budget deficit of nearly $2 trillion in fiscal 2026, equivalent to 6.2% of GDP.3 The U.S. has tended only to run deficits this large during recessions, wars, or other national emergencies. The U.S. is engaged in the war with Iran, but beyond that, economic growth has been solid—which is generally a time you’d want to see smaller deficits or surpluses. Looking ahead, rising interest costs are poised to present a growing challenge. As existing government debt matures and is refinanced at higher rates, interest payments consume a larger share of federal resources. This can crowd out other spending and private investment, which can dent growth over time. For investors, the 100% threshold does not necessarily signal an immediate fiscal crisis, but the longer-term trajectory deserves attention. Sustained borrowing can put upward pressure on Treasury yields and limit the government’s flexibility to respond to future economic challenges.
Jobs and Inflation Data May Force the Fed’s Hand – Let’s start with recent October jobs data.
According to the Bureau of Labor Statistics, the U.S. labor market showed renewed strength in October, with employers adding 165,000 jobs, well above economists’ expectations of 59,000. The unemployment rate also declined to 4.1%, while revisions to August and September figures added another 84,000 jobs. Over the past three months, the economy has averaged 137,000 new jobs per month, suggesting hiring has regained momentum following a midyear slowdown.
A separate report from payroll processor ADP also exceeded expectations, showing 86,000 private-sector jobs added in October versus forecasts of 75,000. Though the two reports use different methodologies, both point to stronger-than-anticipated hiring. Solid hiring and sticky inflation may seal the Fed’s fate for the December meeting. The Federal Reserve’s preferred inflation gauge, the Personal Consumption Expenditures (PCE) price index, rose 3.6% year-over-year in September, up from 3.4% in August. Core inflation, which excludes food and energy, reached 3.1%. Consumer spending increased 0.5% for the month but was essentially flat after adjusting for inflation, suggesting higher prices are absorbing much of the increase in household spending. In our view, stronger employment and persistent inflation likely force the Fed’s hand in maintaining restrictive monetary policy, with another rate increase likely in December.5
Put Market Moves in Perspective – With the midterm elections behind us, investors are looking ahead to what comes next for markets. Keeping a long-term perspective can help you assess shifting headlines and recognize potential opportunities amid uncertainty.
Our free guide, Using Market Volatility to Your Advantage2, explores the potential benefits of market turbulence and lessons from history. Discover:
- How market volatility can “shake up” complacent investors
- Potential bargains that may be uncovered through turbulence
- Why volatility may help prevent overheating and market “bubbles”
- What history shows us about opportunities for steady investors in turbulent markets
- Plus, more ways you may be able to benefit from a volatile market
Take a more informed approach to market uncertainty. Download your free copy today!
Disclosure
2 ZIM may amend or rescind the free guide offer, Using Market Volatility to Your Advantage, for any reason and at ZIM’s discretion.
3 Wall Street Journal. October 29, 2026. “Federal Debt Hits 100% of GDP.”
4 FRED Economic Data. October 9, 2026. “Federal Debt Held by the Public.”
5 Wall Street Journal. November 6, 2026. “Robust Hiring Defied Expectations in October, With 165,000 New Jobs.”
DISCLOSURE
Past performance is no guarantee of future results. Inherent in any investment is the potential for loss.
Zacks Investment Management, Inc. is a wholly-owned subsidiary of Zacks Investment Research. Zacks Investment Management is an independent Registered Investment Advisory firm and acts as an investment manager for individuals and institutions. Zacks Investment Research is a provider of earnings data and other financial data to institutions and to individuals.
This material is being provided for informational purposes only and nothing herein constitutes investment, legal, accounting or tax advice, or a recommendation to buy, sell or hold a security. Do not act or rely upon the information and advice given in this publication without seeking the services of competent and professional legal, tax, or accounting counsel. Publication and distribution of this article is not intended to create, and the information contained herein does not constitute, an attorney-client relationship. No recommendation or advice is being given as to whether any investment or strategy is suitable for a particular investor. It should not be assumed that any investments in securities, companies, sectors or markets identified and described were or will be profitable. All information is current as of the date of herein and is subject to change without notice. Any views or opinions expressed may not reflect those of the firm as a whole.
Any projections, targets, or estimates in this report are forward looking statements and are based on the firm’s research, analysis, and assumptions. Due to rapidly changing market conditions and the complexity of investment decisions, supplemental information and other sources may be required to make informed investment decisions based on your individual investment objectives and suitability specifications. All expressions of opinions are subject to change without notice. Clients should seek financial advice regarding the appropriateness of investing in any security or investment strategy discussed in this presentation.
Certain economic and market information contained herein has been obtained from published sources prepared by other parties. Zacks Investment Management does not assume any responsibility for the accuracy or completeness of such information. Further, no third party has assumed responsibility for independently verifying the information contained herein and accordingly no such persons make any representations with respect to the accuracy, completeness or reasonableness of the information provided herein. Unless otherwise indicated, market analysis and conclusions are based upon opinions or assumptions that Zacks Investment Management considers to be reasonable. Any investment inherently involves a high degree of risk, beyond any specific risks discussed herein.
The S&P 500 Index is a well-known, unmanaged index of the prices of 500 large-company common stocks, mainly blue-chip stocks, selected by Standard & Poor’s. The S&P 500 Index assumes reinvestment of dividends but does not reflect advisory fees. The volatility of the benchmark may be materially different from the individual performance obtained by a specific investor. An investor cannot invest directly in an index.